
A 1% Expense Ratio Robs You Of $244,918
Most investors enter the stock market by default through a 401(k) or pension scheme, while self-directed investors are routinely told to buy and hold basic index funds.
Pushing traditional index funds overlooks two critical realities. First, managed index funds charge expense ratios and are controlled by institutions whose primary goal is making money off your money—meaning you take 100% of the risk while they profit regardless of market performance.
A 1.0% expense ratio equates to $10 per year for every $10,000 invested. Over a 30-year period with an average 8% annual return, that 1.0% fee extracts $104,558 in direct deductions. Because those dollars are pulled out rather than left to compound, your true lost wealth reaches $244,918. Instead of finishing with $1,114,862, your final balance drops to $869,944.
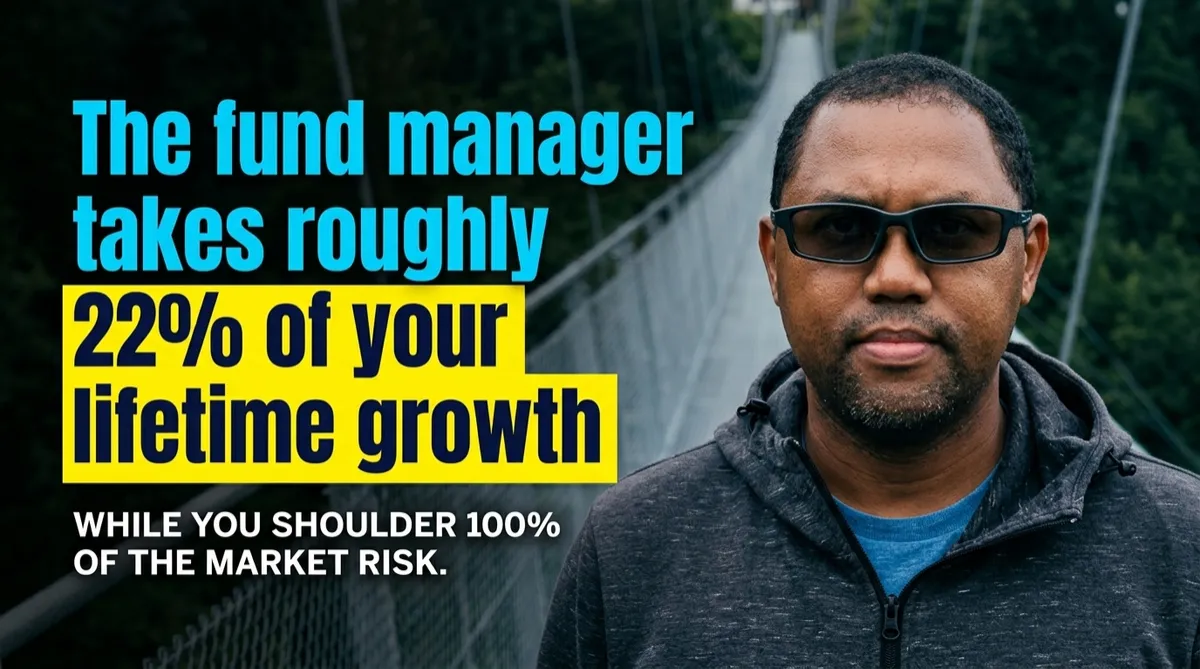
The fund manager takes roughly 22% of your lifetime growth while you shoulder 100% of the market risk.
The True Cost of Fees Over Time
A comparison of a 1.0% actively managed fee against a 0.05% low-cost index and a 0% direct ownership strategy based on a $50,000 initial investment with $5,000 annual contributions:
The Compounding Leak Breakdown
Years 1–10 (The Early Phase): The fee drag seems minimal initially, but by Year 10, a 1.0% fee creates a total value gap of about $15,000.
Years 10–20 (The Snowball Phase): As your portfolio expands, fees are calculated on a larger capital base, expanding the loss gap past $72,000 by Year 20.
Years 20–30 (The Damage Phase): In the final decade of compounding, fees devour your returns. In Year 30 alone, you pay nearly $8,700 in annual fees, driving total wealth destruction to $244,918.
The Wealth Triangle (Growth, Dividends and Covered Calls)
The three pillars of the strategy—Long-Term Capital Appreciation and Medium-Term Dividend Yield as well as Short term revenue in the form of Covered Call weekly income.
The Wealth Triangle Strategy Explained:
Appreciation and DCA: Making one pot of money pay you three times.
The Dividend & ETF Engine: How to identify quality dividend-paying stocks (Dividend Aristocrats) and high-yield ETFs (JEPI, SPYI, QQQI).
Covered call Income: Safely using Options to generate a "Weekly Paycheck" without taking on gambling-style risk.
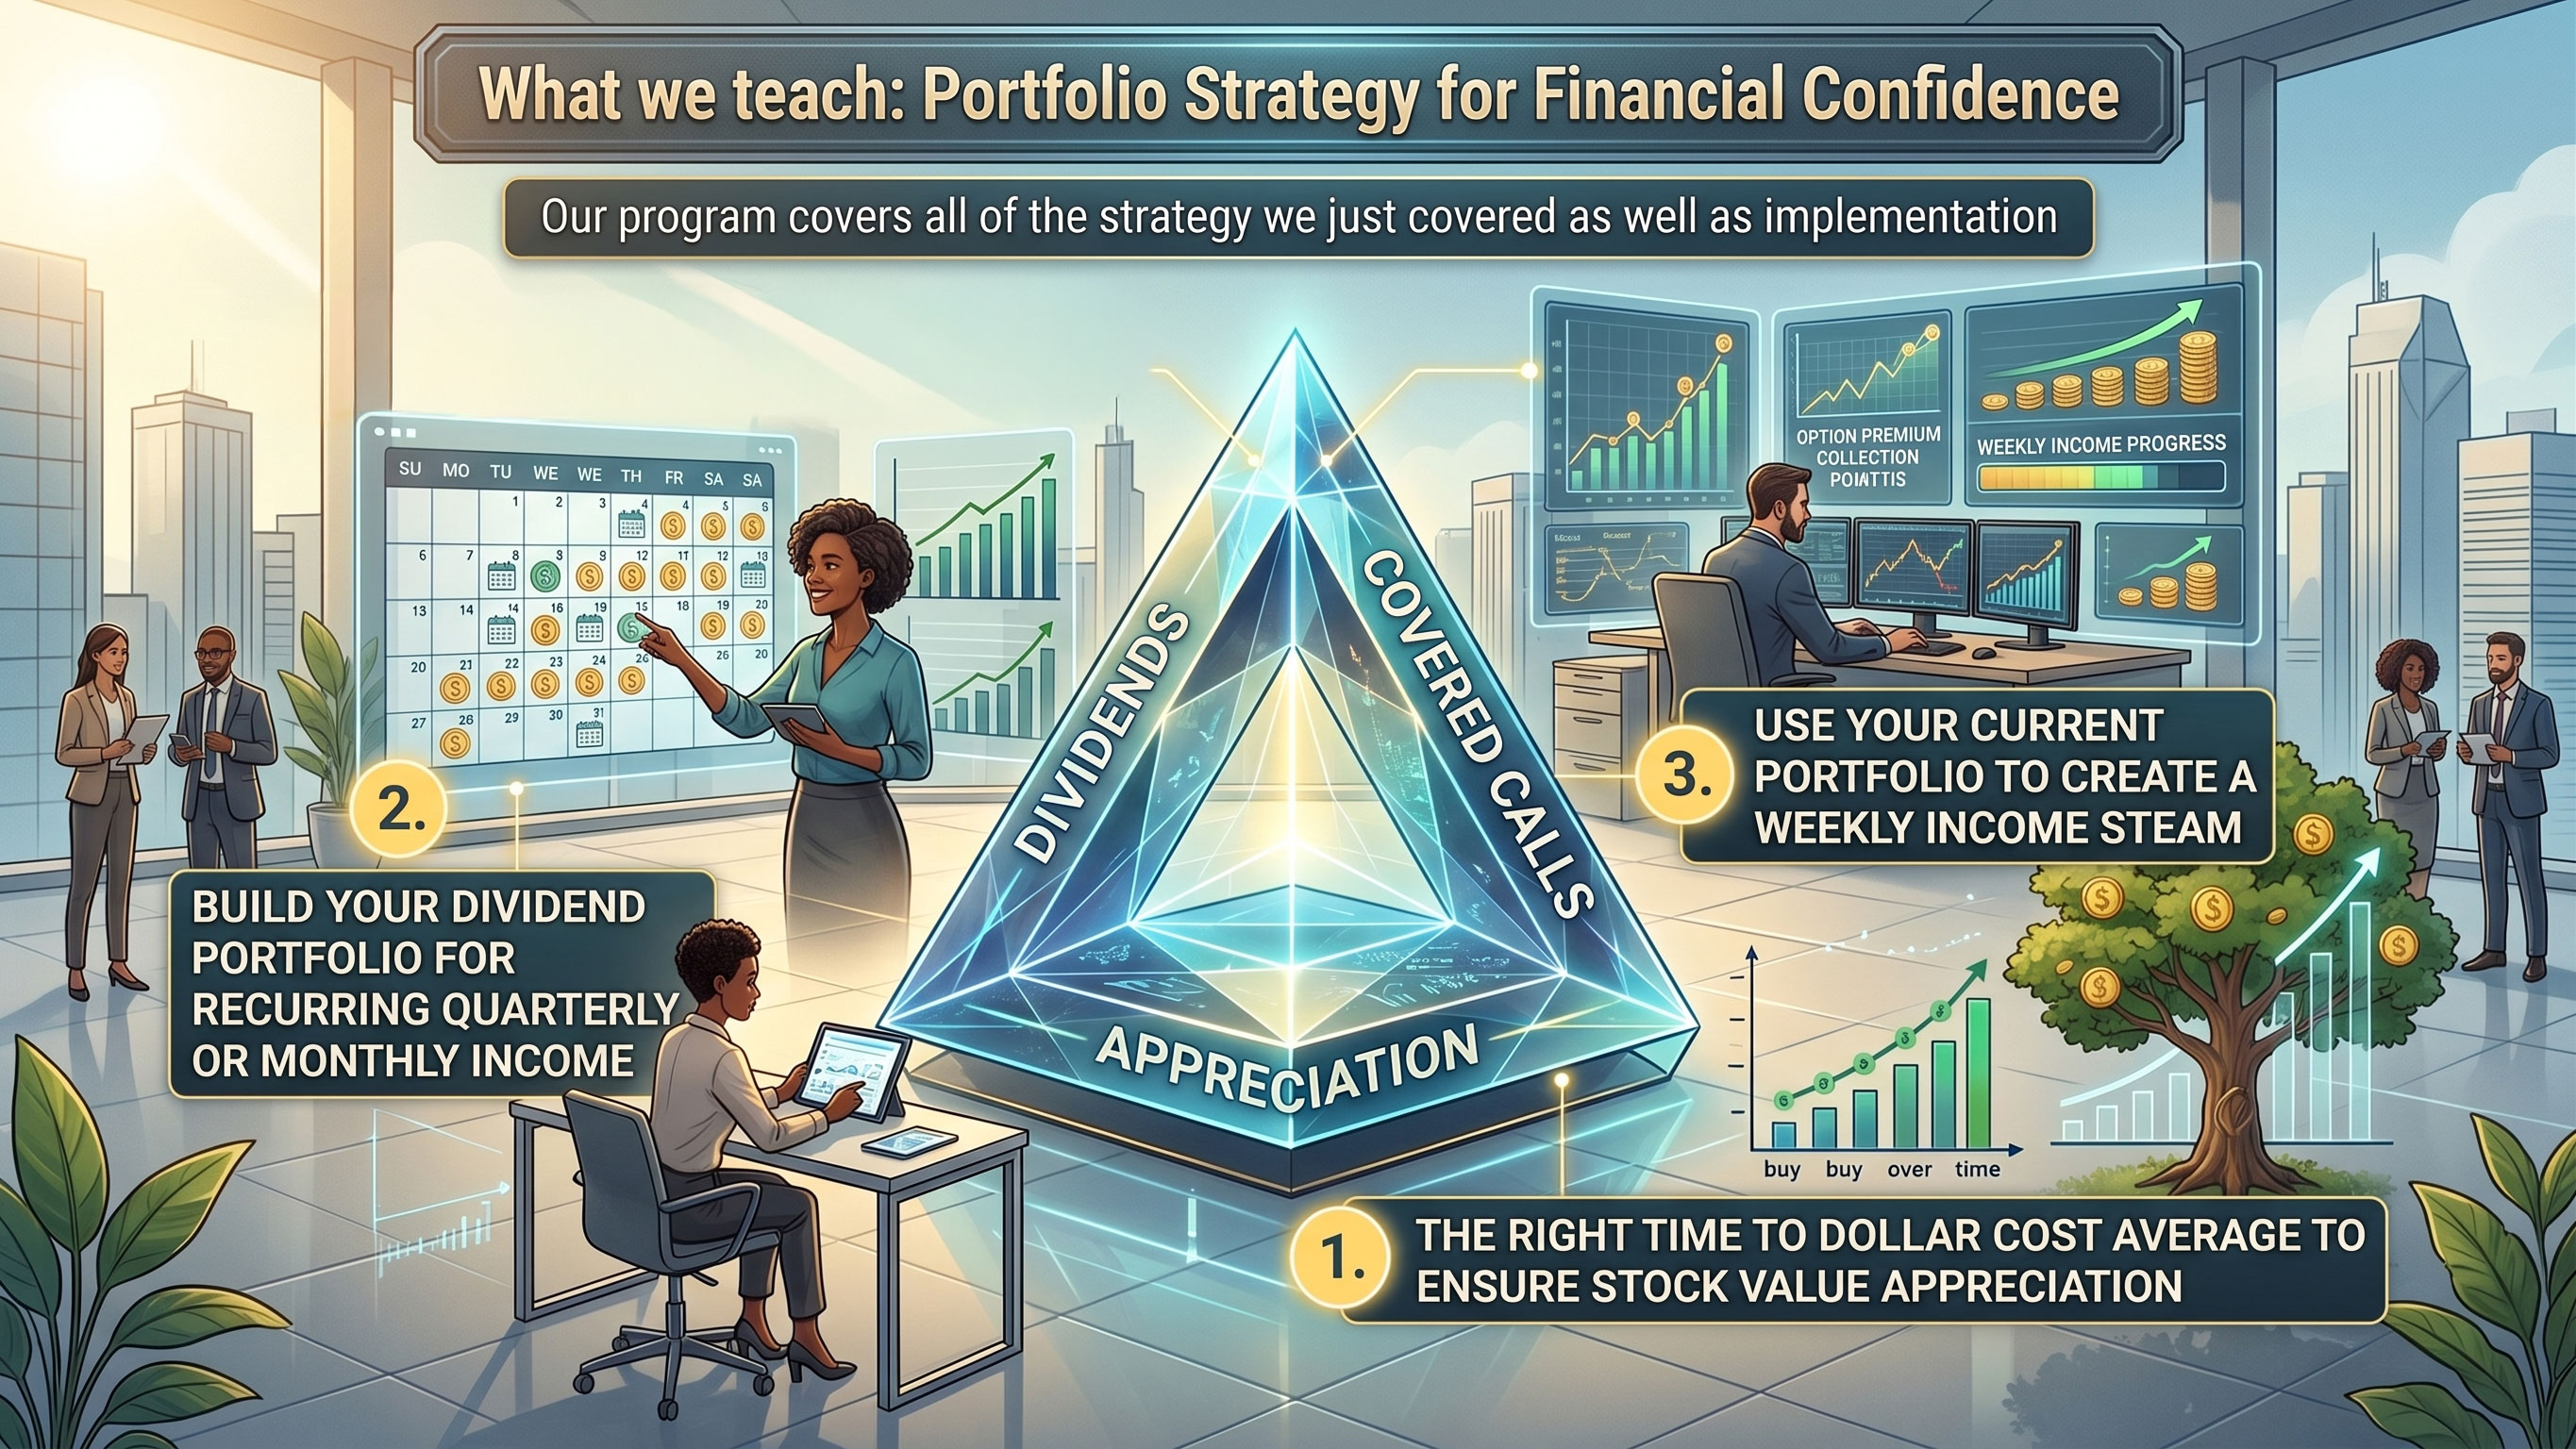
Below is an example of the Wealth Triangle strategy in action and if you would like some more information come an join us here at Mindshift Theory and our Wealth Circle community.
Total annual CASH flow return = $139200
We created a simple calculator below so you can see exactly how much money you are losing to portfolio management services—money you worked hard to earn.
Investing isn't difficult. The industry wraps it in jargon to make it seem like it's strictly for professionals—primarily so you'll hand over your hard-earned cash for them to manage for a handsome fee.
If you want to learn how to manage your own portfolio and keep every penny you earn, join us at the Wealth Circle. We offer straightforward financial knowledge without the jargon. We don't want to manage your money—we want to show you how to manage it yourself so you keep 100% of the profits.