

Flipping the Script on Passive Income with the JNJ Capital Loop
Most people spend their entire lives trading blocks of time for a linear paycheck. At Mindshift Theory, we challenge that status quo. The goal is to shift your mindset from being an active worker to becoming a market engineer—structuring your existing capital so it generates independent, automated cash flow that feeds upon itself.
Today, we are looking at how to build an internal compounding engine using a rock-solid cornerstone asset: Johnson & Johnson (ticker: JNJ). By pairing defensive fundamentals with high-probability options mechanics, you can create a systematic loop that accumulates shares completely on the market's dime. [Trustpilot]
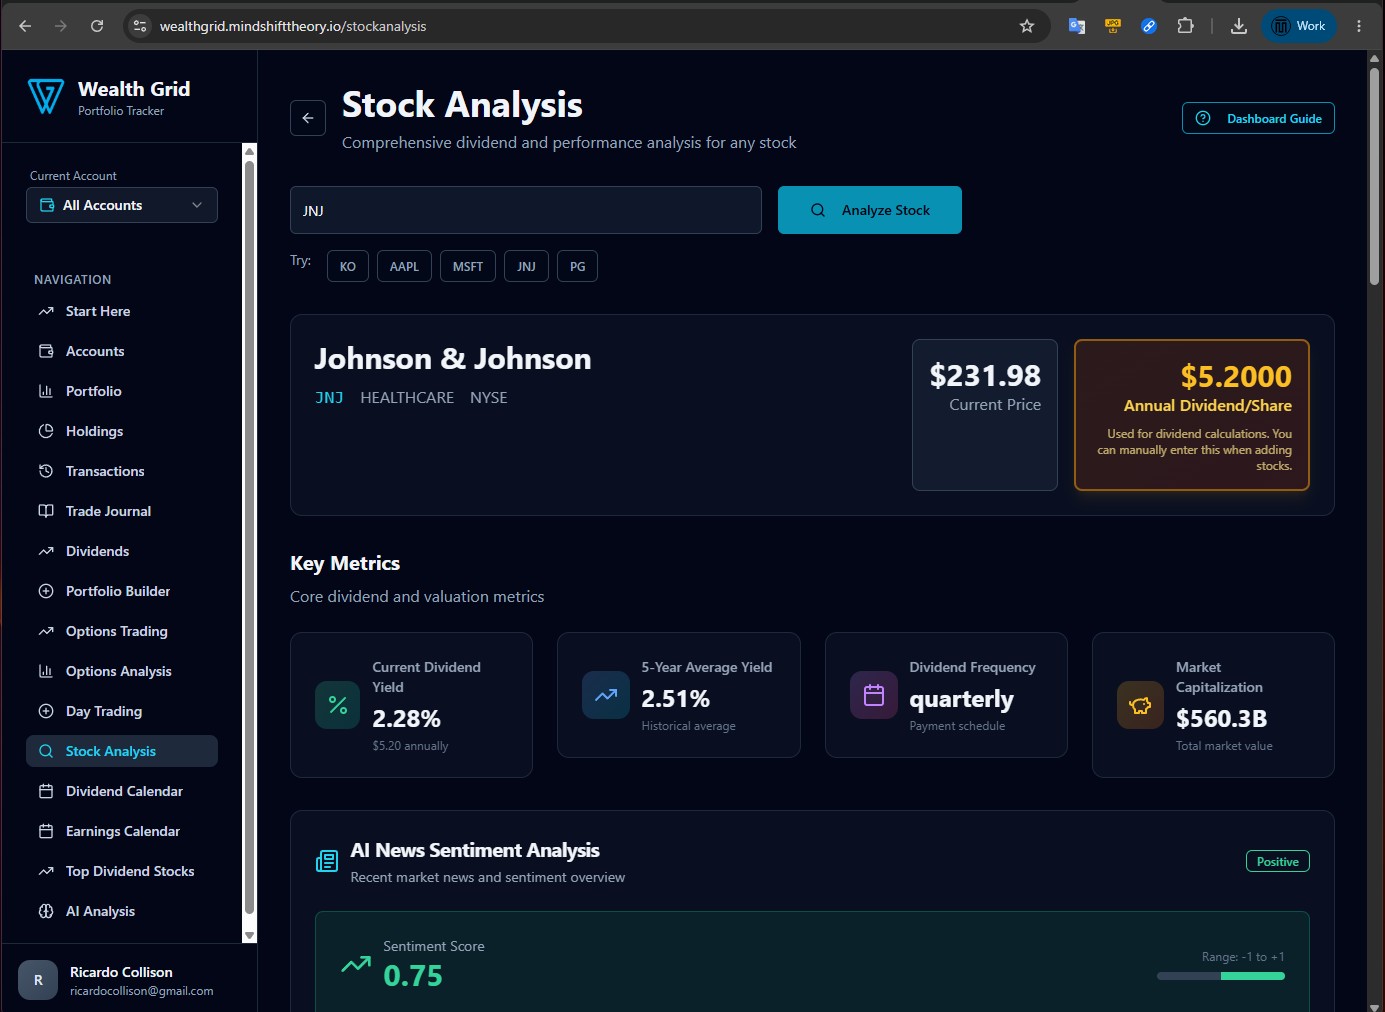
1. Deconstructing the Foundations: The Core Metrics
Before you write an option or buy a single share, you must ensure the underlying asset can handle the weight of your capital. JNJ is a legendary dividend king, but to understand its true engine power, you need to look past the brand name and look straight at the mechanics.
Price to Earnings (P/E) Ratio:
P/E Ratio = Stock Price / Earnings Per Share (EPS)
This shows how much the market is currently willing to pay for every dollar of JNJ's net accounting income. JNJ typically fluctuates between 21x and 26x. It tells us whether we are paying a premium or grabbing a defensive bargain.
Price to Cash Flow (P/CF) Ratio:
P/CF Ratio = Stock Price / Operating Cash Flow Per Share
Net earnings can be manipulated by accounting adjustments, tax write-offs, or massive legal reserves. The P/CF ratio cuts through the noise, evaluating the stock price purely against the physical, liquid cash moving through JNJ’s ecosystem.
Free Cash Flow (FCF) Per Share:
FCF Per Share = Operating Cash Flow - Capital Expenditures/ Total Shares Outstanding
Free Cash Flow is the undisputed lifeblood of income investing. It is the raw capital left over after JNJ funds its laboratories, factories, and daily operations. If FCF per share is healthy and growing, it guarantees the company can keep buying back stock, clearing debt, and feeding your dividends.
Dividend Payout Ratio (per Earnings):
Payout Ratio = Dividends Per Share / Earnings Per Share
This tells you what percentage of profits are kicked back to investors versus what is kept for corporate expansion. JNJ maintains a safe, highly strategic layout of 50% to 60%, giving you strong immediate income while leaving plenty of fuel in the tank for corporate acquisitions and R&D.
The Macro Sentiment Shift
JNJ recently underwent a spectacular structural bull run, climbing from a 52-week low of $149.04 up to a peak of $251.71, before settling into its current consolidation. Powered by exceptional growth in its MedTech division and an oncology pipeline that diluted patent cliff fears, management has pushed its full-year adjusted EPS midpoint guidance to $11.55. JNJ is no longer deep-value cheap, but as a premier defensive vehicle trading near fair value, it remains an ideal anchor for cash flow generation.
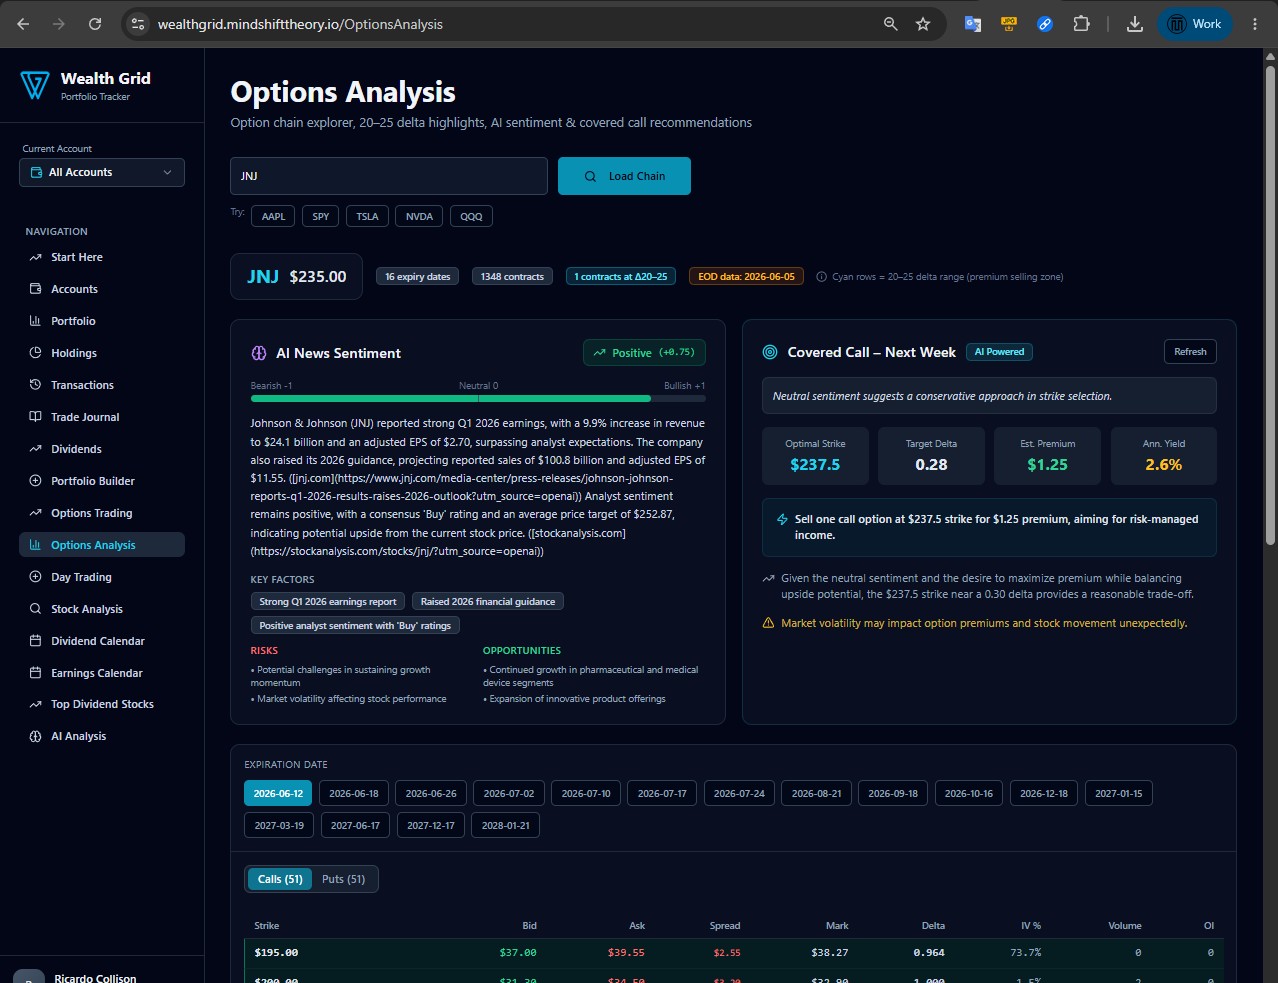
2. The Mechanics: The 20-Delta Covered Call Loop
The core strategy here relies on a self-funding loop: you hold 100 shares of JNJ to capture the underlying dividends and structural growth, while systematically selling out-of-the-money weekly covered calls to extract immediate cash flow.
By targeting a 20 delta, you are choosing a strike price that historically has roughly an 80% probability of expiring worthless. This gives you a massive statistical edge. You harvest the weekly option premium, and instead of spending it, you deploy that capital directly back into your portfolio through dollar-cost averaging (DCA).
Here is what the actual income generation looks like year-to-date (spanning roughly 23 weeks):
MetricConservative
Weekly Premium: $0.50 per share ($50/contract) =
Total Weeks Active YTD: (Weeks23) = 23
Gross Generated Cash Flow: $1,150
⚠️ Mindshift Reality Check: Because JNJ went on an absolute tear earlier this year (vaulting aggressively from ~$200 up past $250), a strict 20-delta weekly execution would have faced heavy upward pressure. If you didn't want your shares called away, some of that gross premium would have been recycled into rolling the contracts up and out. Expect your actual net realized income to sit closer to the conservative floor—which is still over $1,100 of pure compounding fuel.
3. Chart Analysis & Execution Zones
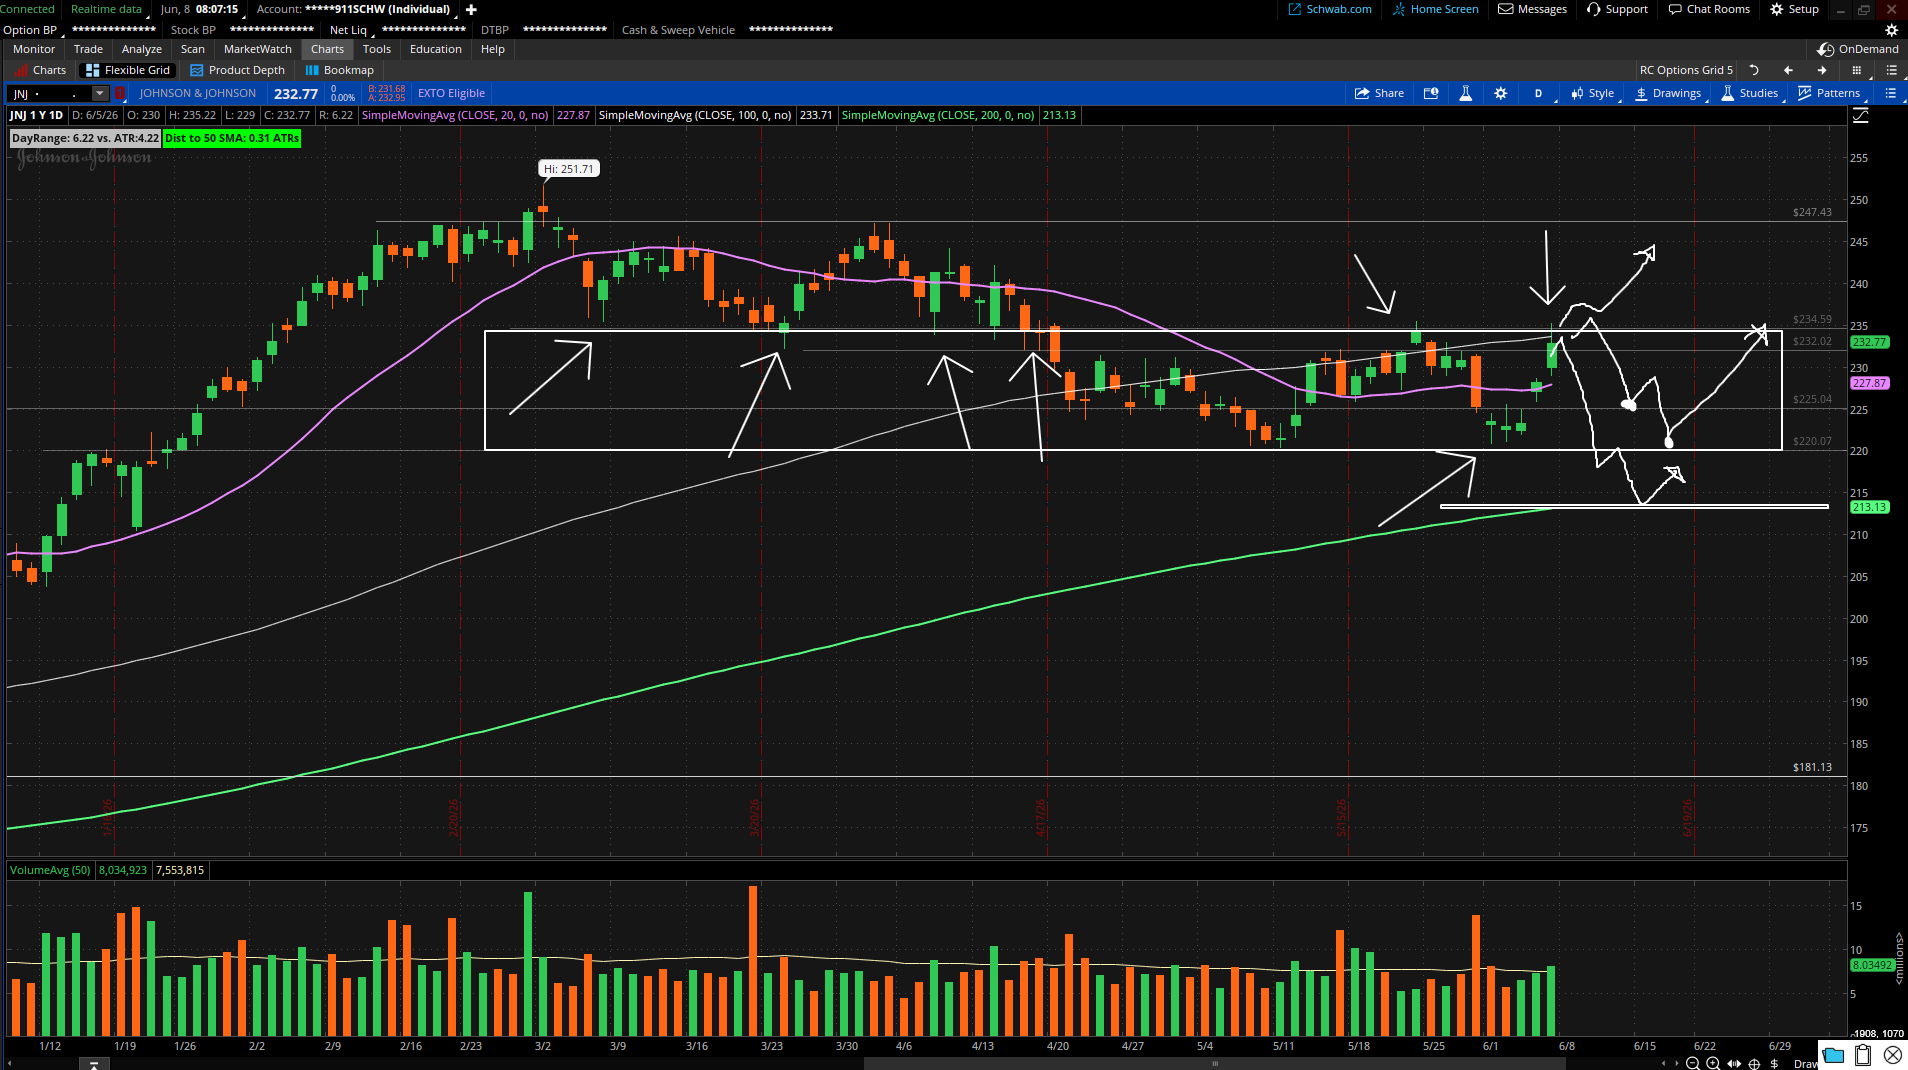
To execute this strategy flawlessly, you cannot just buy randomly. You need to read the landscape. Looking at the 1-year daily JNJ chart above, JNJ is trading at $232.77 and is coiling perfectly inside a healthy consolidation framework.
The Moving Average Blueprint
20-Day SMA (Magenta Line - $227.87): The short-term trend floor. JNJ has reclaimed this level, signaling buyers are actively stepping back into the driver's seat.
100-Day SMA (Grey Line - $233.71): The immediate overhead ceiling. The price is currently fighting right below this level. Reclaiming it is the key to unlocking the next macro leg upward.
200-Day SMA (Green Line - $213.13): The ultimate line in the sand. As long as JNJ stays comfortably above this baseline, the structural bull market is structurally sound.
4. Strategic Buying Recommendations
When deploying your accumulated weekly covered call premiums, use the technical key levels shown in JNJ chart to dictate your accumulation sizes:
The Momentum Trigger (Current Price - $232.77): If you need to keep your cash working immediately, deploying regular micro-DCA amounts here is acceptable. A clean, daily close above the 100-day SMA ($233.71) serves as a green light that the correction is officially over.
The High-Conviction Dip Channel ($220.00 – $225.00): If overhead resistance pushes the stock down, look to aggressively concentrate your options income here. This zone represents a highly proven horizontal support floor over the last two months and offers an optimal risk-to-reward ratio.
The Maximum-Conviction Baseline ($213.00): If a broader market correction drags JNJ down toward its rising 200-day SMA ($213.13), throw out the script. This is an elite value accumulation zone that allows you to lock in an elevated dividend yield with an immense safety margin.
By shifting your mindset away from simply collecting static dividends, you turn your portfolio into an active financial factory. You extract premium from the market's volatility, convert it into shares of a premium asset, and let the loop run forever.
#JNJ #OptionsTrading #DividendInvesting #CoveredCalls #PassiveIncome #stockmarket2026
🚨 DISCLAIMER: I am not a financial advisor. This video is for educational and entertainment purposes only. Investing involves risk. Always do your own research before trading stocks or options.